Joel Carlson Data Scientist
Novel Methods for Predicting Gentrification
The code and a README for this project are available here!
Here is a modified version of the presentation I gave at Galvanize related to this work:
The goal of this project was to test two hypotheses:
-
Changes in the rate of Taxi pickups and dropoffs in an area precedes changes in the price of rental units
-
Changes in the rate of liquor licenses issued in an area precedes changes in the price of rental units
Why would anyone think these may predict changes in rental prices?
Well, about three years ago I moved into a small neighborhood in South Korea. At the time it was a little dingy, mostly small local restaurants; I had been partially motivated to move there by the extremely low rent.
By the time I left, about two and a half years later, the area was cleaner, had more upscale businesses, and heavy pedestrian traffic. The rental prices had also skyrocketed. Looking around the area I saw new coffee shops, new bars, and significant night life. That is, liquor serving establishments (which need licenses), and people (who need transportation - taxis). I wondered - Did these precede the rent increases?
Why Predict Rental Prices?
Aside from the obvious potential for investments in up-and-coming areas, another reason to investigate rental prices is to be able to predict which areas may undergo gentrification. Being able to anticipate gentrification could lend early insight to policy makers, who may then be able to implement measures such as rent-control to prevent local residents being priced out of their homes.
The Data
Data for this project came primarily from three sources:
Taxi pickups and dropoffs were aggregated using the New York City open taxi data portal. Files were downloaded as one ~30 Gb CSV per year, and aggregated using shell scripts.
Liquor licenses were downloaded from the New York Liquor Authority database. Scraping was automated with Selenium, and html data parsed with BeautifulSoup.
Rental prices from Zillow were used as prediction targets.
Scripts for downloading, cleaning, and combining the data can be found hereherehere.
For a complete listing of the data sources considered and compiled for this project, see data.md
Extracting Trends from the Data
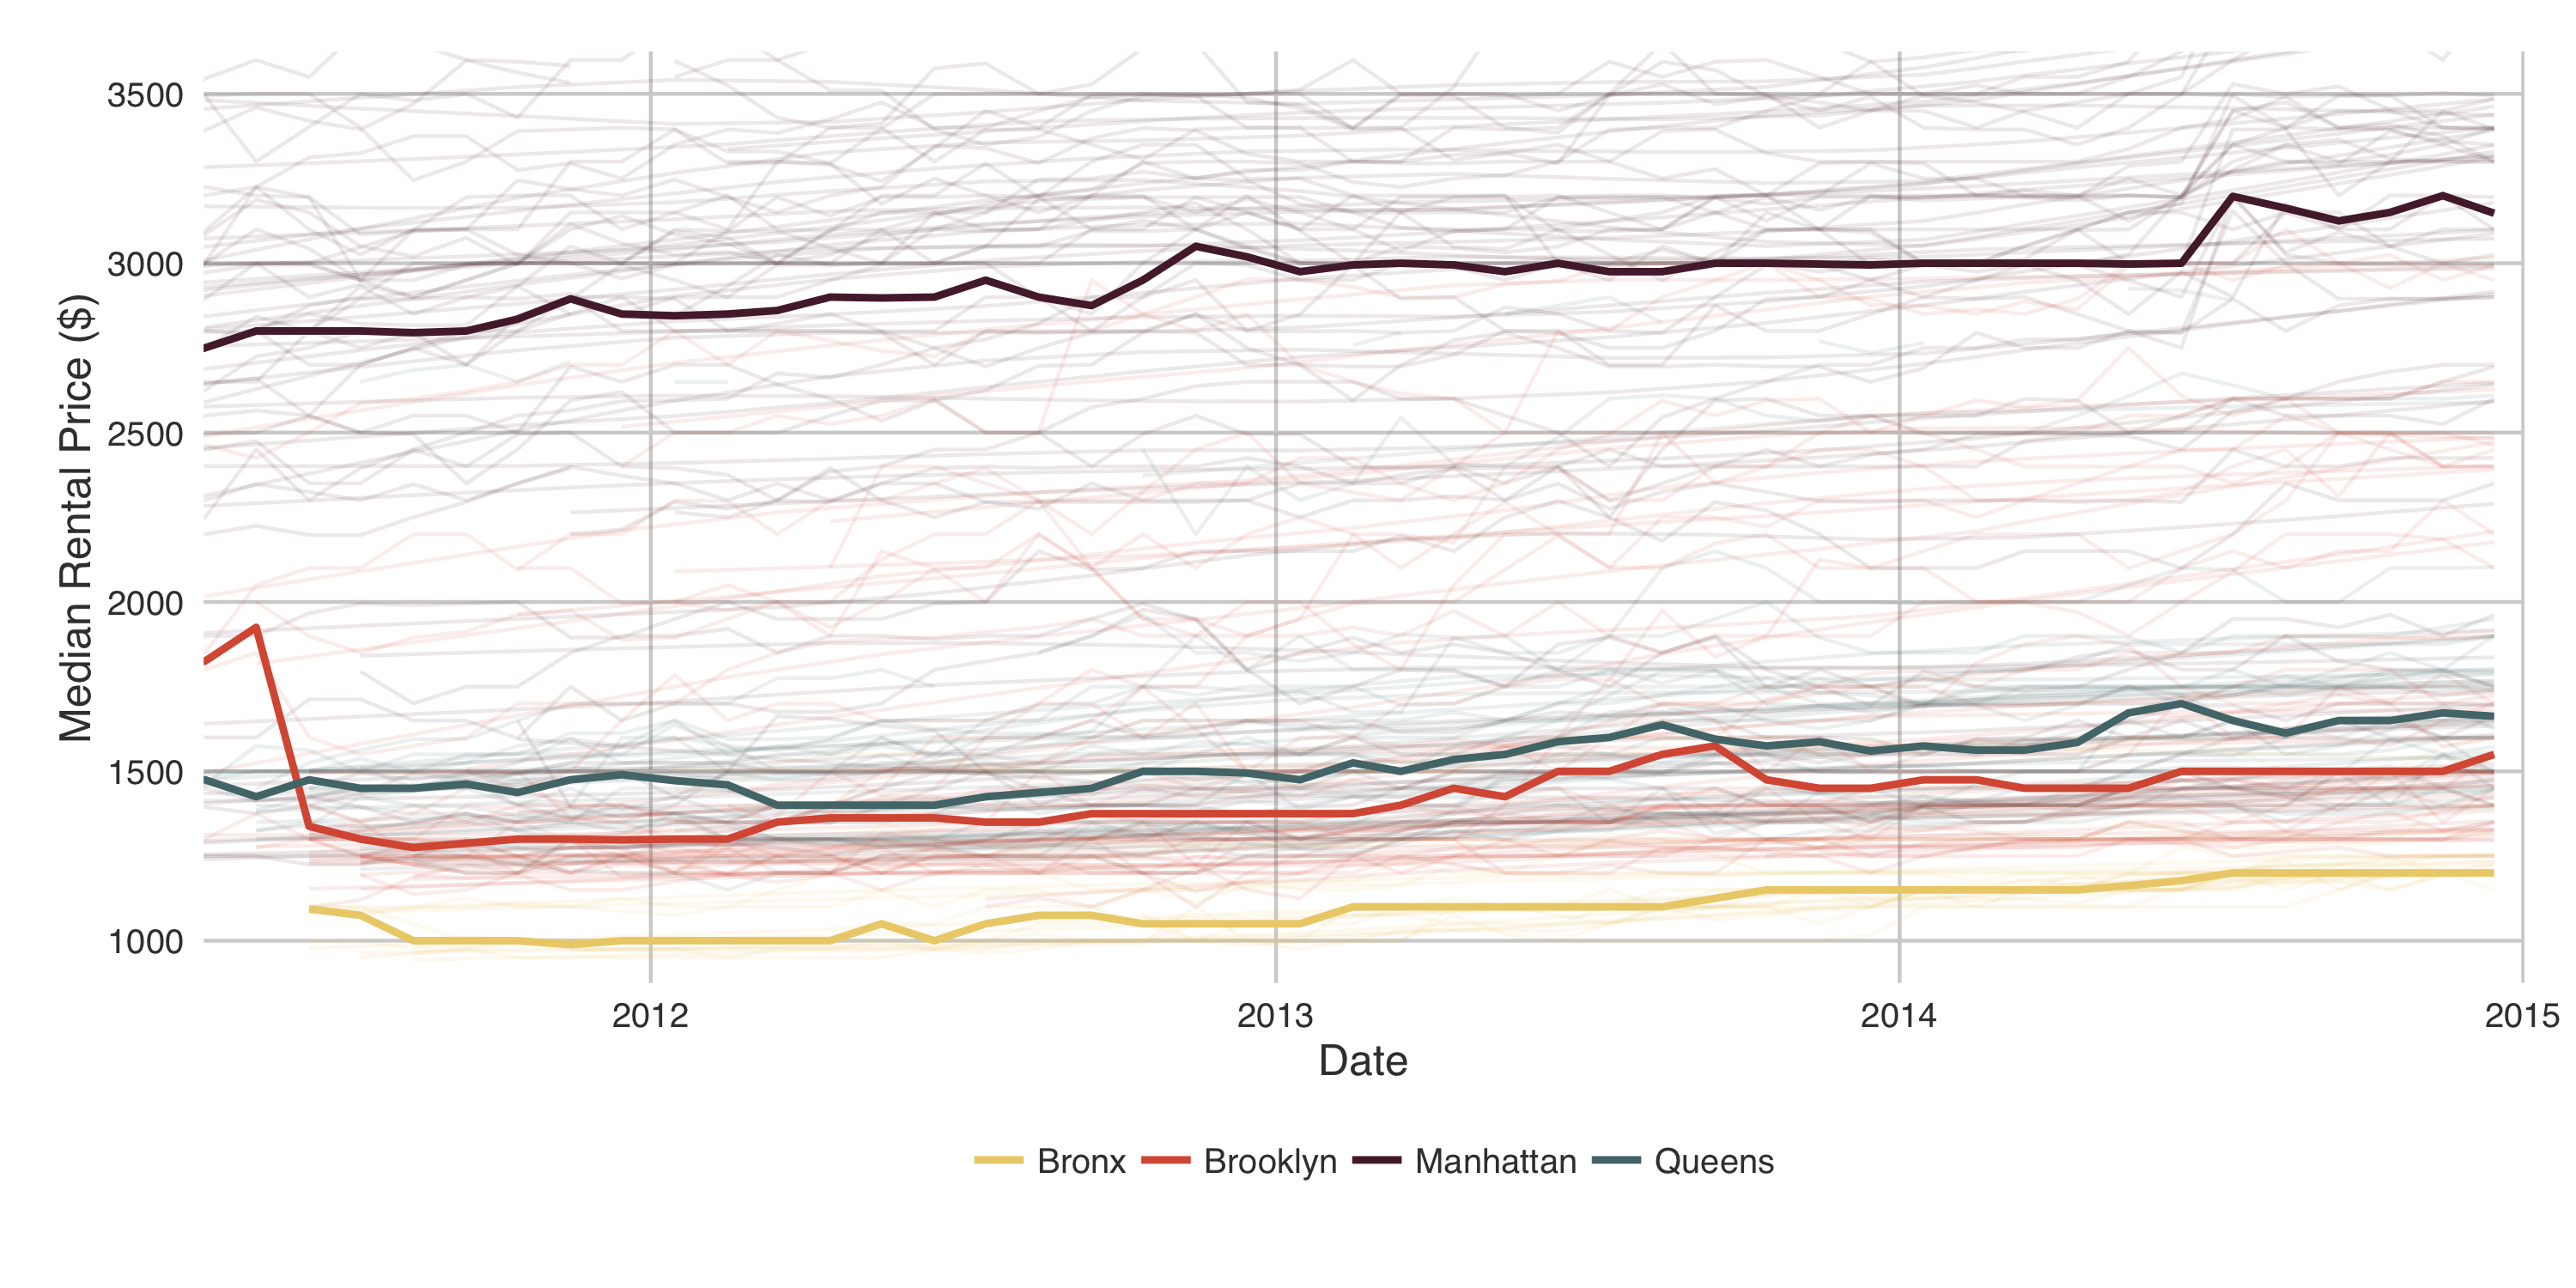
The prediction target for this project is not the median monthly rental price in a given zipcode, rather it is the change in monthly rental price. Therefore the monthly changes must be extracted from each zipcode, shown below:

This is, in a word, noise. To coerce the data into a better behaved form I used STL decomposition to remove the seasonal component, and create a useful trendline. This was completed on all zipcodes in NYC.
The decomposition and resulting better behaved prediction target for a representative zipcode:
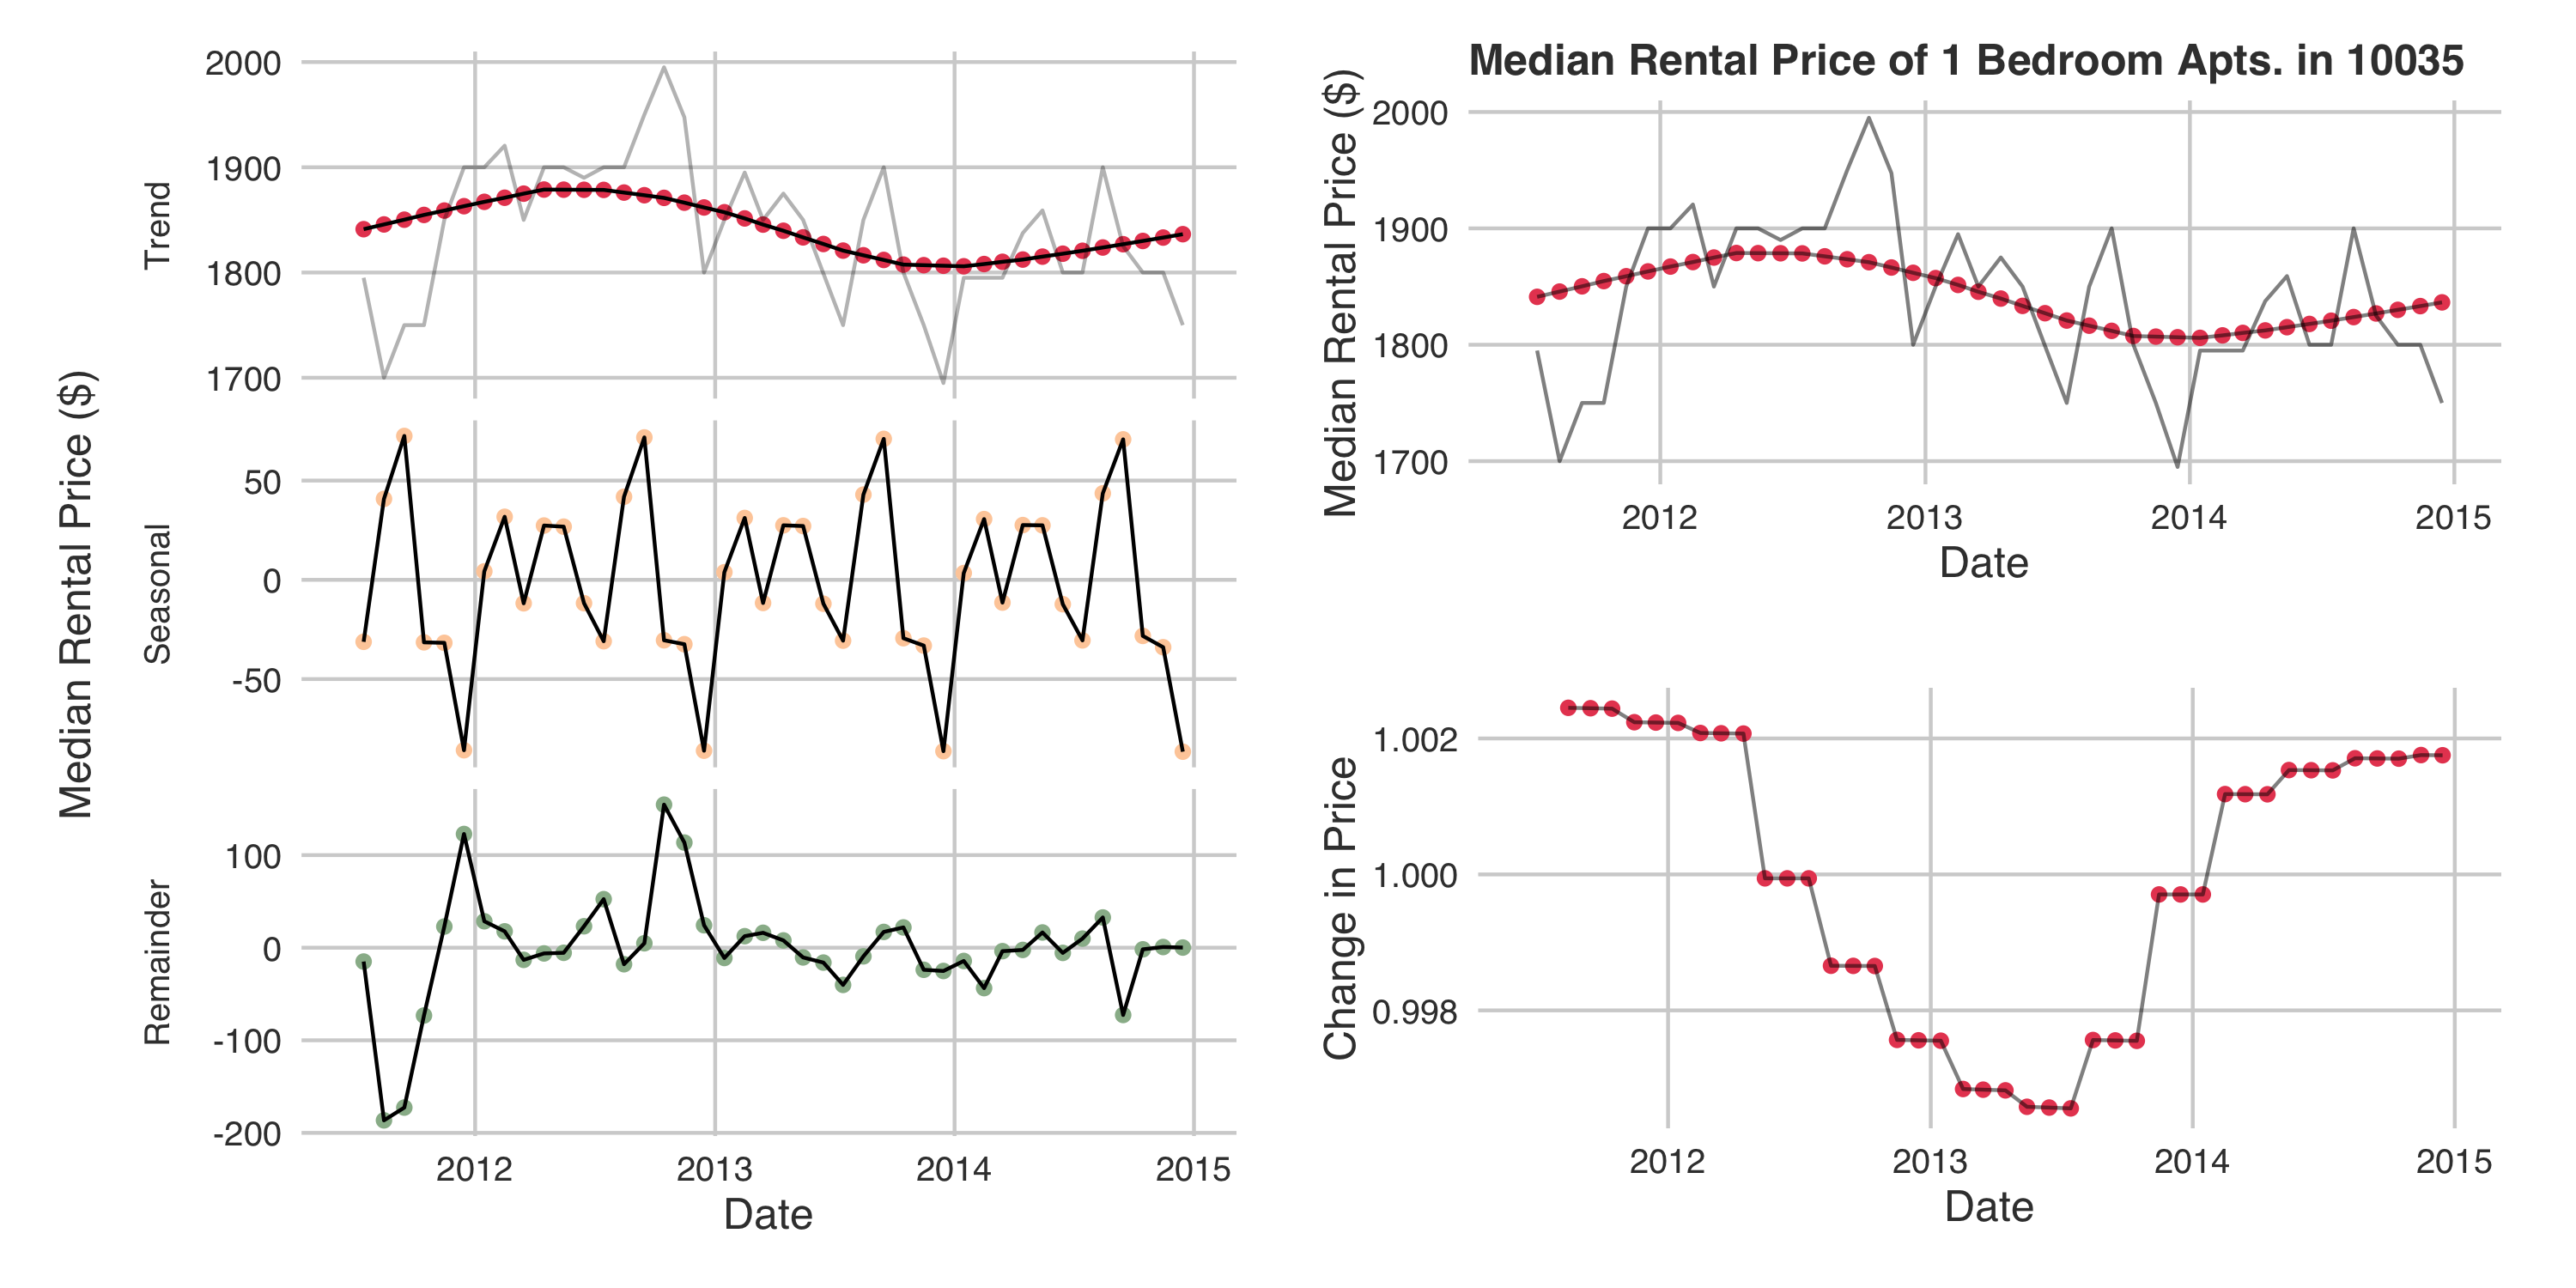
Trends were also extracted from the liquor license and taxi time series data.
Building Models to Predict Changes
Several different models were built to predict the changes in monthly median rental prices.
Naive
The most naive approach, built to serve as a basis for comparison, is a model which predicts that the change each month will be the same as the average monthly change of the training data.
Vector Autoregression (VAR)
VAR modeling is a classical time series forecasting approach. VAR models allow the use of multiple time series for forecasting. Thus, for each zipcode a VAR model was built using the changes in monthly rental prices lagged from 3 to 12 months, the liquor license data, and the taxi pickup and dropoff data (on the same lag timeline).
Random Forest
Random forests are not a typical method for forecasting time series data. However, lagged time series data can be thought of as features for modeling. Thus, random forest models were built utilizing the entire dataset (that is, using data from all zipcodes). This allows for a much more general model that is not coupled to an individual zipcode. A model, from here referred to as “RF”, was built using only lagged changes in the monthly rental price (from 3 to 12 months). A second model was built using the lagged data, along with lagged liquor and taxi data, from here referred to as “Full RF”.
Model Goals
The VAR model tests the statistical hypothesis that, for a given zipcode, impulses in the liquor or taxi data are related to changes in the rental prices.
A further test of the predictive ability of the liquor and taxi data is given by the random forest models. If the liquor and taxi data predicts the changes in rental price, then we would expect the model including the liquor and taxi data (Full RF) to have better forecasting accuracy than the model without (RF).
Forecasting Changes in Rental Prices
We can visualize the accuracy of the predictions by extrapolating a trendline using the predicted changes. That is, we train a model using data up to a certain date, and predict the changes in median rental price after that date. We then extract the rental price at the final date of the training data from a given zipcode. We can then predict the rental price in that zipcode by successively multiplying the predicted change by the current price. This is shown below, along with the bootstrapped RMSE of the models as a function of time from the last training point:
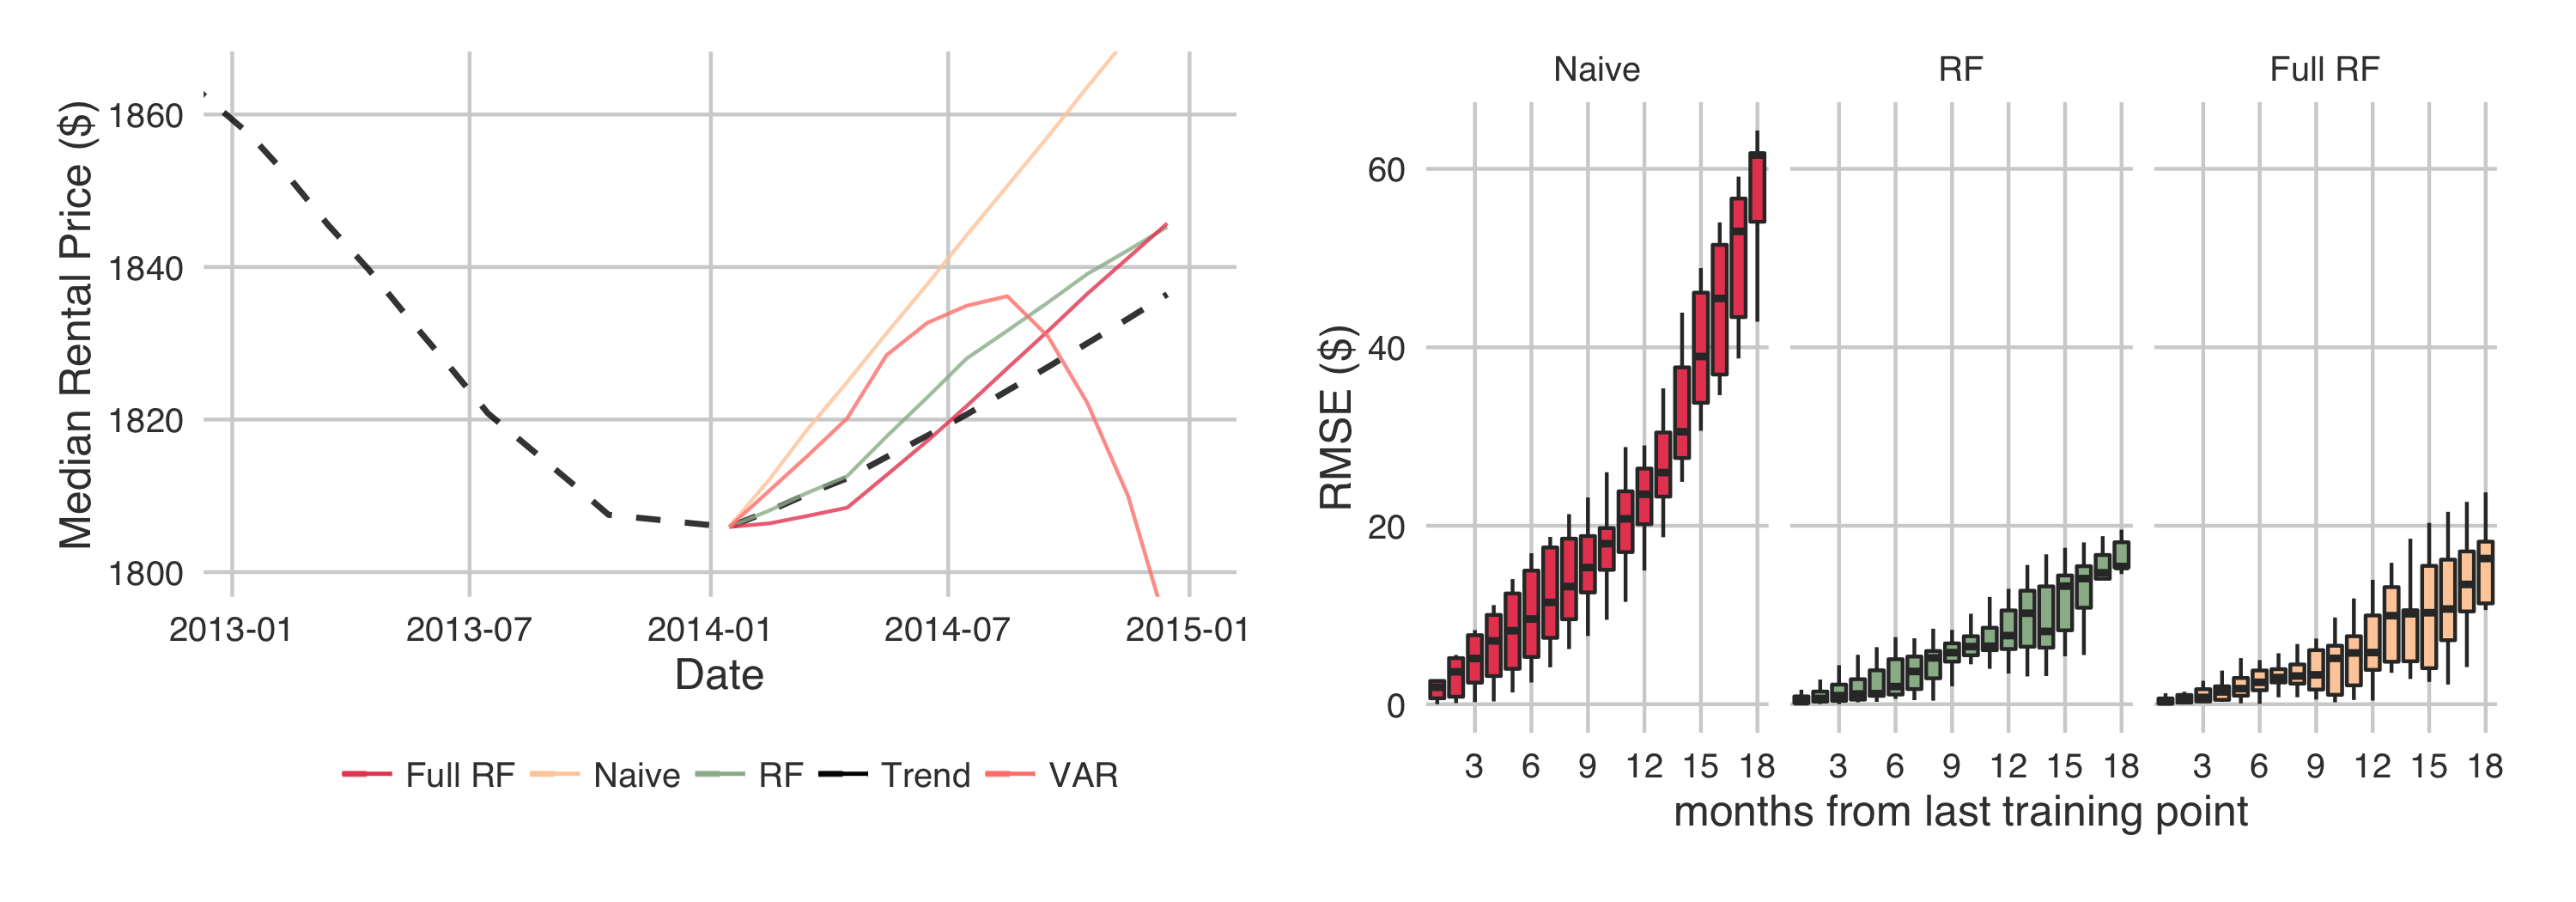
The VAR model and naive model are clearly outperformed by the random forest models. Unfortunately, the VAR model failed to find statistically significant relationships between either the taxi and rental price data, or the liquor license and rental price data. Sad news for the hypotheses.
The nail in the coffin for the two hypotheses is clear in the RMSE plot - there is no added predictive power from including the taxi and liquor data.
However, we do have models which predict rental prices much more accurately than simply predicting the average change (naive)!
What Can We Learn From the Models?
Although overall including the liquor and taxi data does not improve predictive accuracy, there is a somewhat bimodal distribution in the difference between the accuracy of the models with and without the liquor and taxi data. If we highlight the zipcodes for which including the liquor and taxi data creates better models on a map we acquire the following:
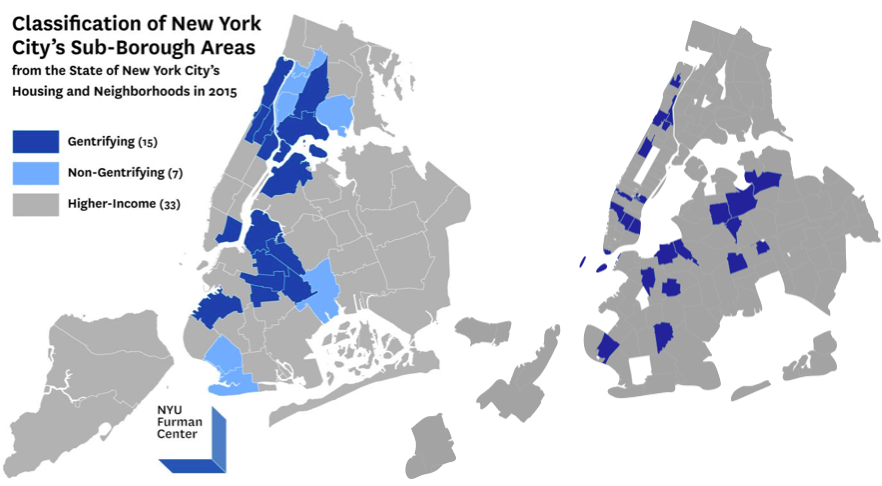
On the left is a map published by the NYU Furman Center for Urban Planning and Public Policy which highlights regions which are undergoing gentrification. On the right is the map produced by highlighting regions where inclusion of liquor and taxi data improves model performance. We see that there is almost complete overlap. A notable exception is the region near Citi Field (on the map on the right), which is more recently getting lots of media attention related to gentrification.
Perhaps there is some signal after all.