Joel Carlson Data Scientist
The Dangers(?) of Improperly Centering and Scaling Your Data
Recently I was at a conference where many of the presentations involved some sort of machine learning. One thing that I noticed was that often times the speakers would make no mention of being careful to not contaminate their test set with information from their training set.
For example, for certain machine learning algorithms, such as support vector machines, centering and scaling your data is essential for the algorithm to perform. Centering and scaling the data is a process by which you transform each feature such that its mean becomes 0, and variance becomes 1. If you center and scale your data before splitting it into training and test sets, then you have used information from your training set to make calculations on your test set. This is a problem. Or could be, at least.
This was concerning me at the conference, but I didn’t speak up about it because although I had been instructed to avoid this mistake, and it made intuitive sense to me, I had never actually tested to see if there was a significant difference between the two methods.
In this post, I am going to explore this by assessing the accuracy of support vector machine models on three datasets:
- Not centered or scaled
- Training and testing centered and scaled together
- Training and testing centered separately
Datawise, we will use a set from the UCI machine learning repository. The dataset is a series of wine measurements, quantifying things like “Alcohol Content”, “Color Intensity”, and “Hue” for 178 wines. The goal is to predict the region the wine came from based on the measurements.
Summarizing the data
Let’s take a quick look at the mean and standard deviation of each column in the data (sorted by SD):
| Variable | Mean | SD |
|---|---|---|
| Proline | 746.89 | 314.91 |
| Magnesium | 99.74 | 14.28 |
| Alcalinity | 19.49 | 3.34 |
| ColorIntensity | 5.06 | 2.32 |
| Acid | 2.34 | 1.12 |
| Flavanoids | 2.03 | 1.00 |
| Alcohol | 13.00 | 0.81 |
| OpticalDensity | 2.61 | 0.71 |
| Phenols | 2.30 | 0.63 |
| Proanthocyanins | 1.59 | 0.57 |
| Ash | 2.37 | 0.27 |
| Hue | 0.96 | 0.23 |
| NonFlavanoidPhenols | 0.36 | 0.12 |
There are 13 variables in the data, but we are going to use only the 5 with the highest standard deviation, since this is for demonstration purposes, not pure predictive accuracy. Although Alcohol is not in the top 5, we are going to use it as well (because hey, we’re talking about wine!)
A bit of intuition
Just so that we have a feel for the data, let’s plot a variable or two: We might be able to guess that there is some relationship between alcohol content and region:
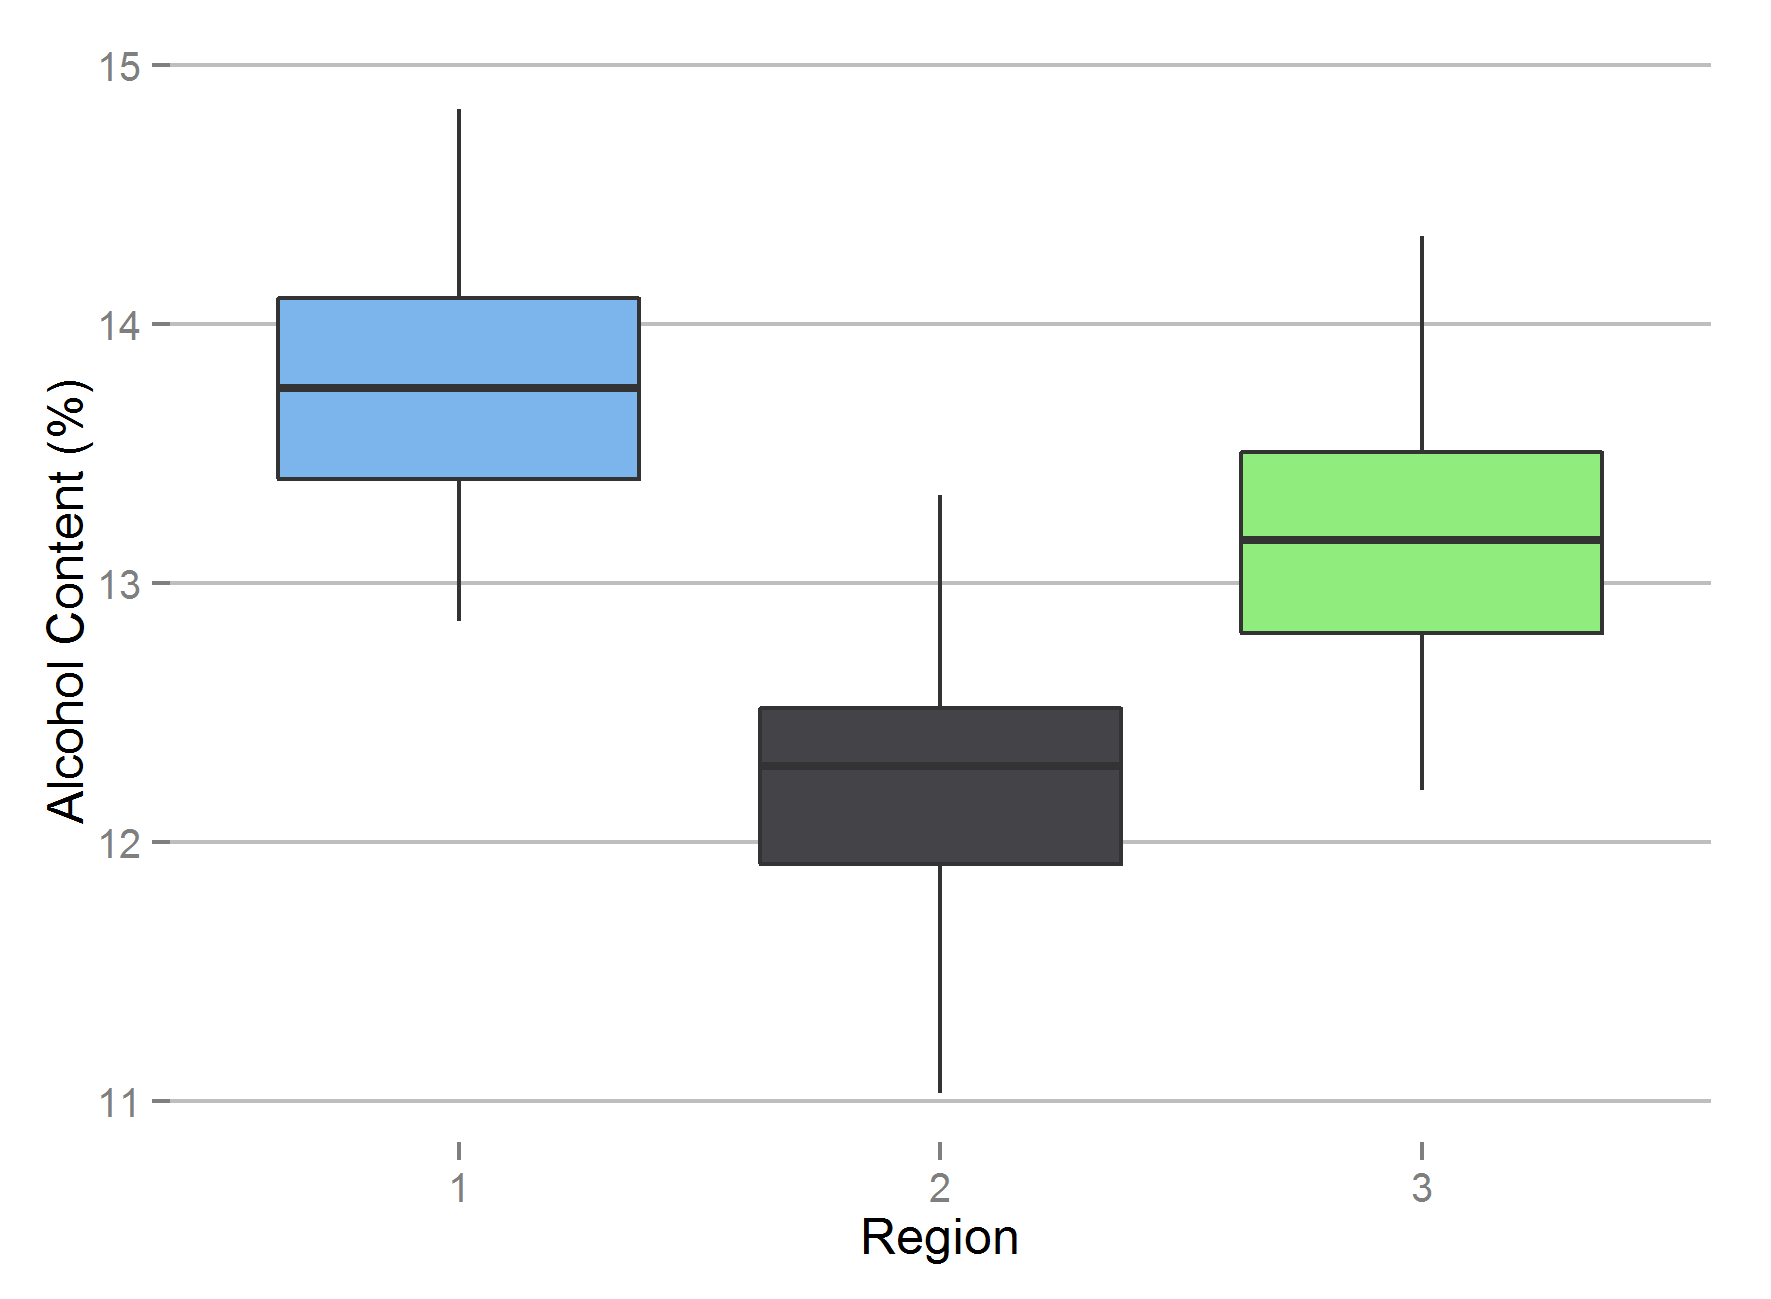
And indeed there is, not a big surprise there.
Wikipedia tells me that, during brewing, Proline may produce haze, so perhaps it would be related to Color Intensity?

As expected. It looks like these variables are going to be able to feed a pretty accurate model. Based on the way the second plot is organized into clusters I imagine even a simple approach like KNN would do well.
Building the models
The features of this data vary wildly in scale, for example, the range of the Proline column is from 278 to 1680, whereas the Acid column goes from 0.74 to 5.80. This is an issue for support vector machines (and some other algorithms), so we need to center and scale the data.
For each situation described above, I trained 1000 svm models from the e1071 R package (with default parameters) and recorded the accuracy. Each model was trained on a random subset of 50% of the data, and tested on the remaining 50%. The test set acccuracy distributions in each situation are presented as histograms.
No centering and scaling
To demonstrate the importance of centering and scaling for support vector machines, the accuracy was first assessed without centering and scaling:
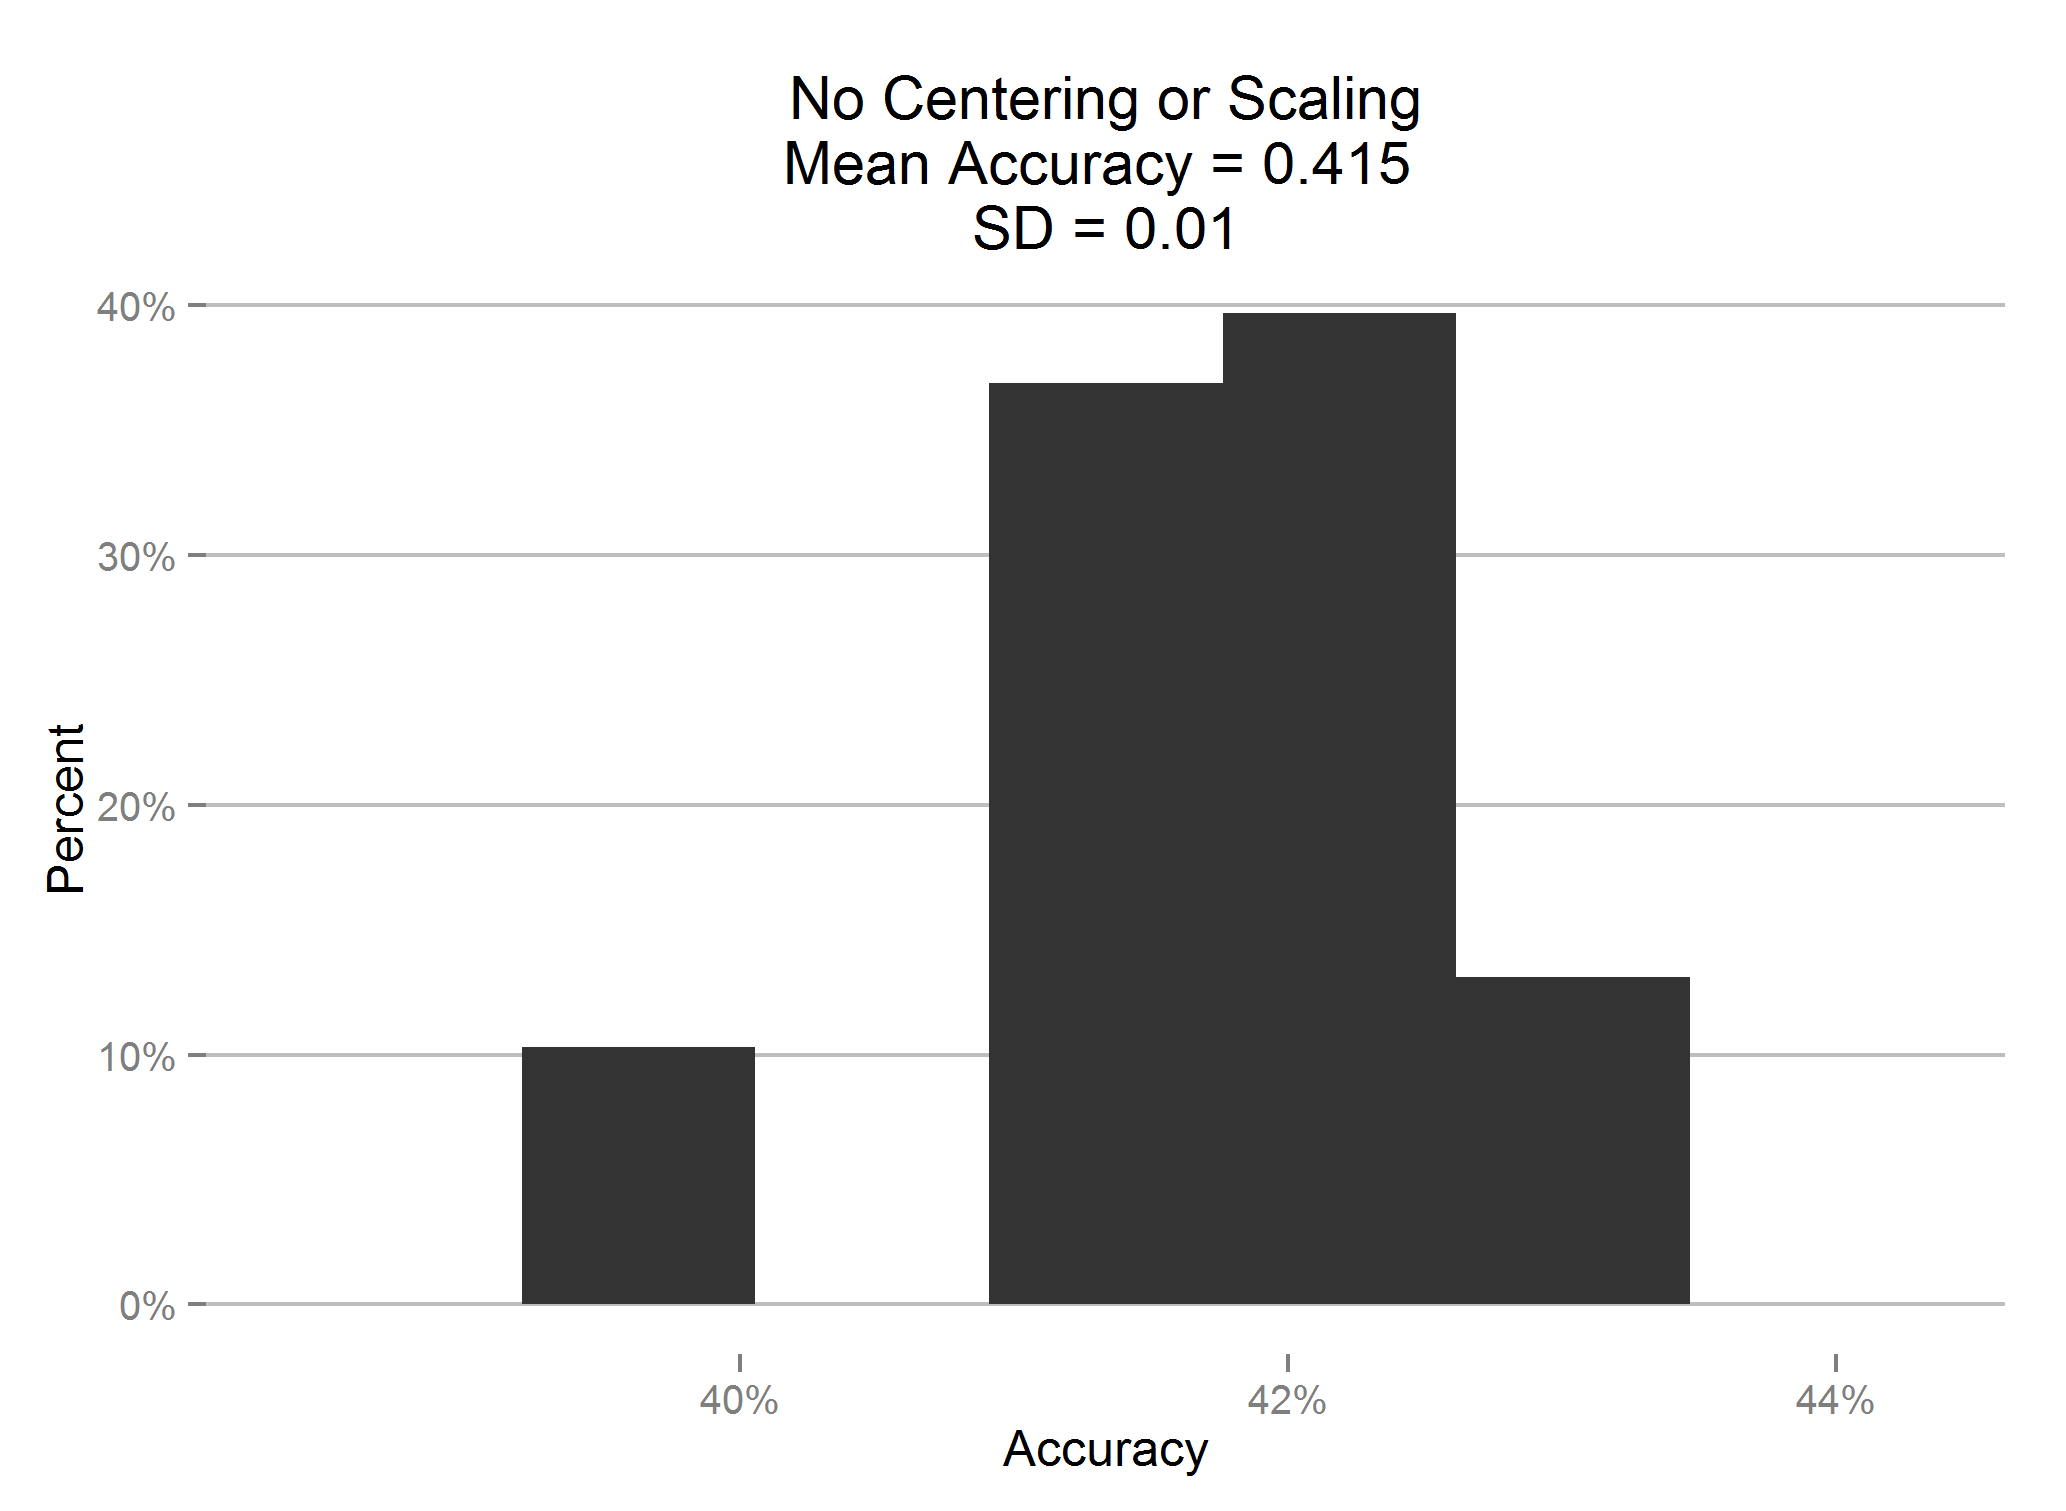
As we can see, the accuracy is pretty abysmal. There are three categories, so the mean of 0.415 is better than guessing, but not by much. Of course, this was expected, centering and scaling are a necessary step for svms.
Scaling Training and Test together
This time we scale the training and test together, and then split them apart for training of the model. This means that there is some information from the test set leaking into the training set, and vice versa.
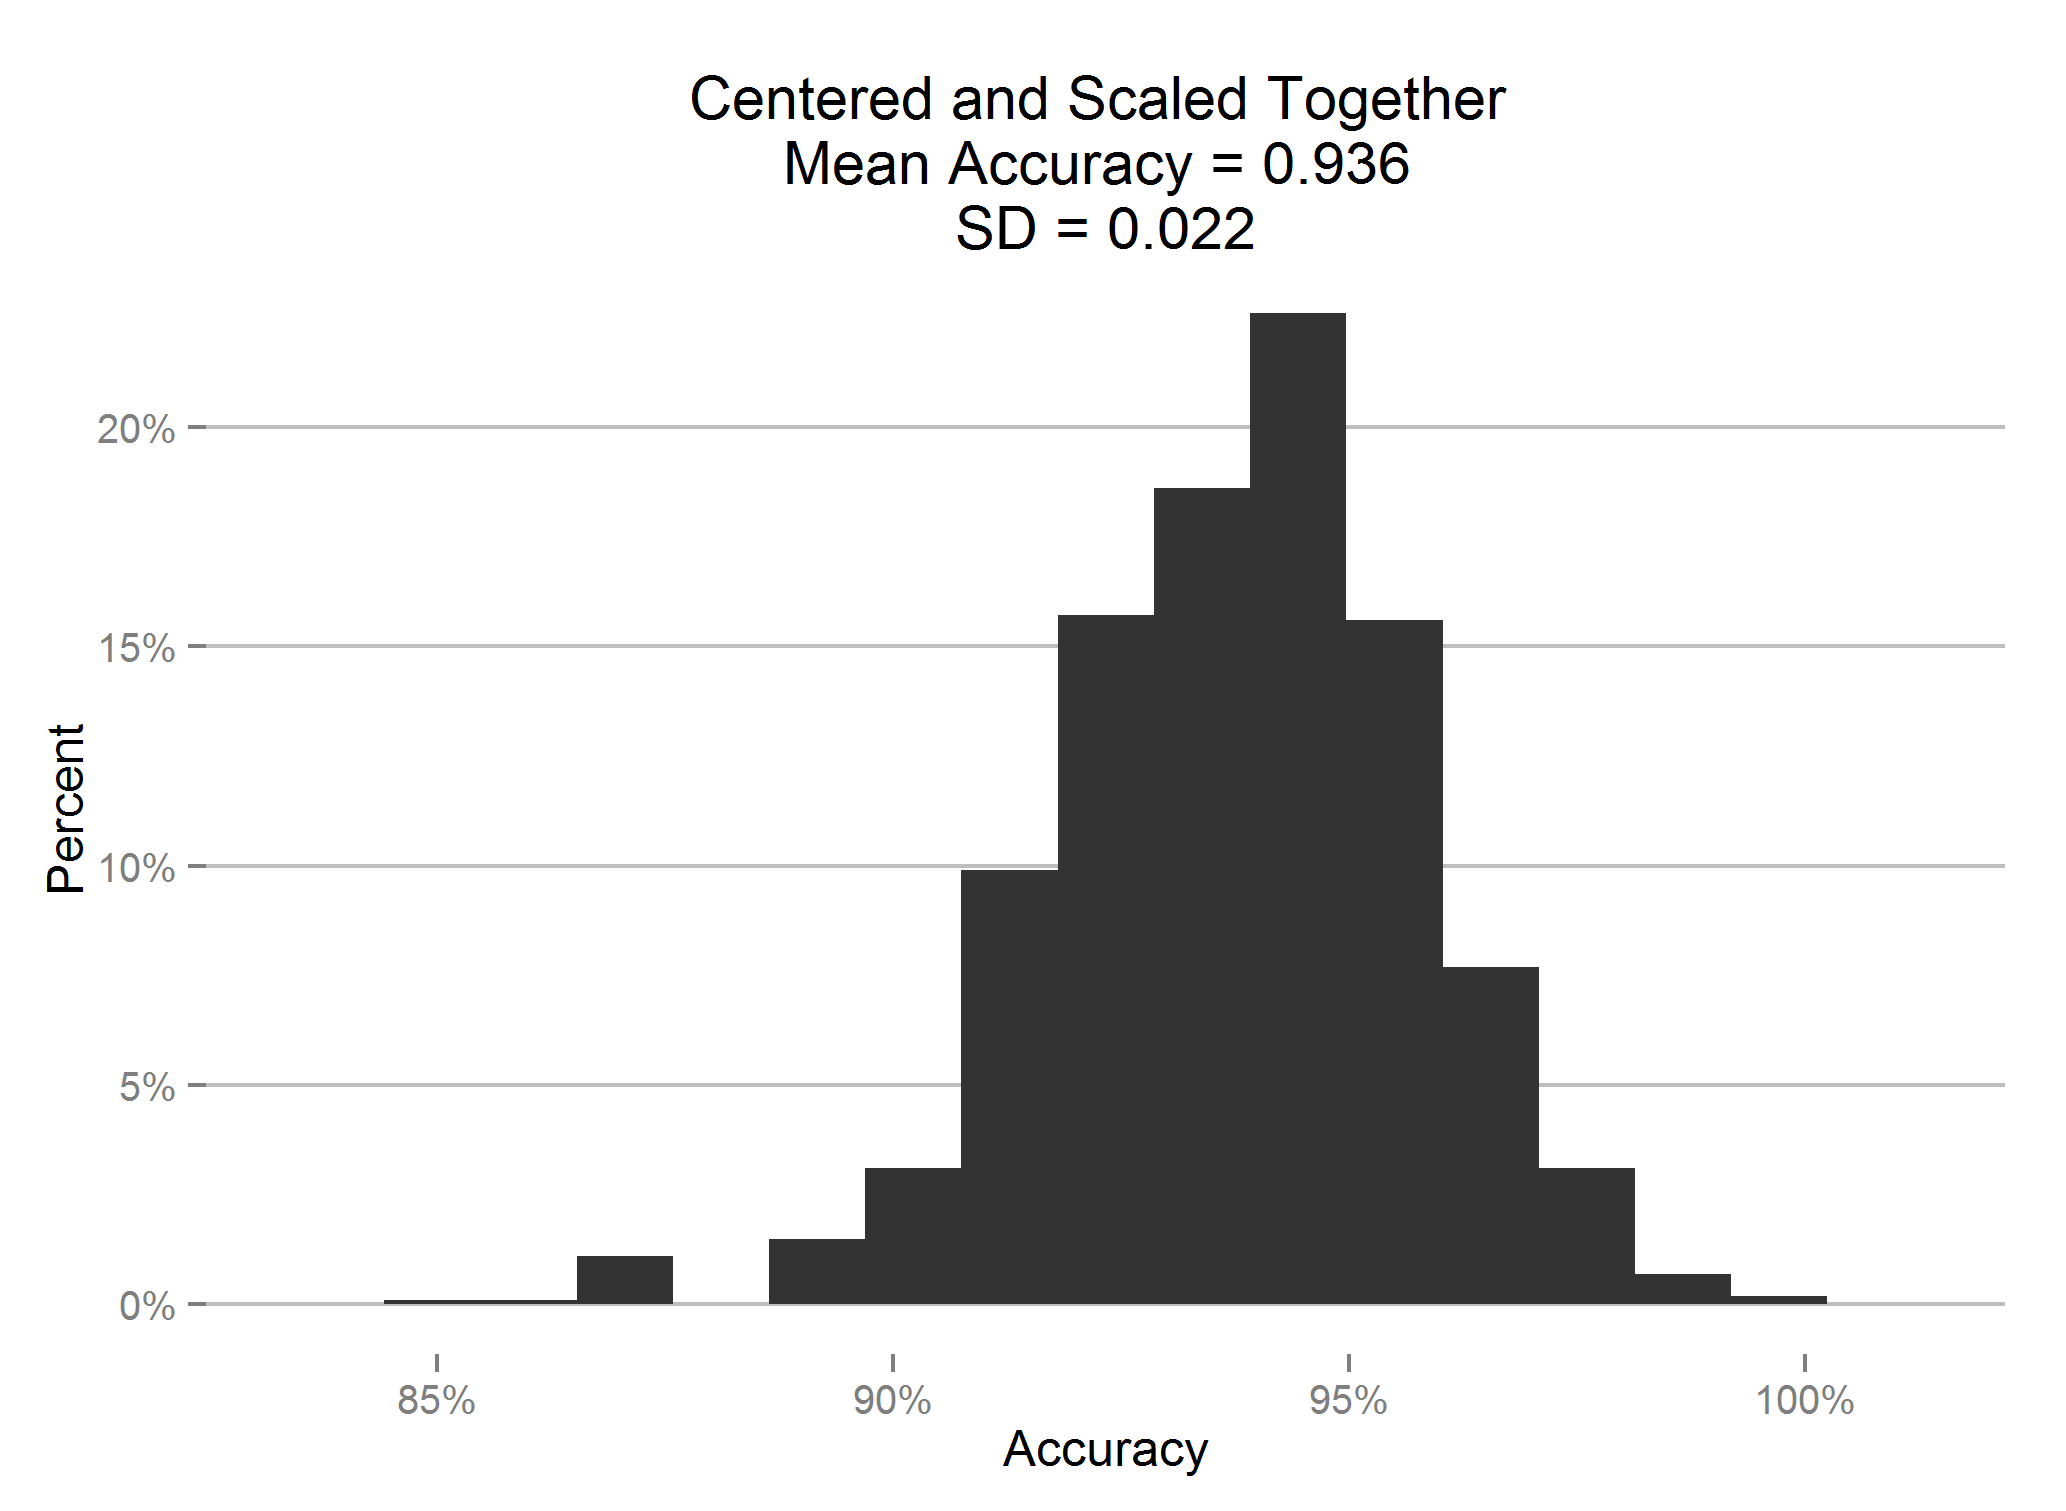
Clearly that made the difference, accuracy is nearly perfect.
Scaling separately (the right way)
Well, this is the right way.
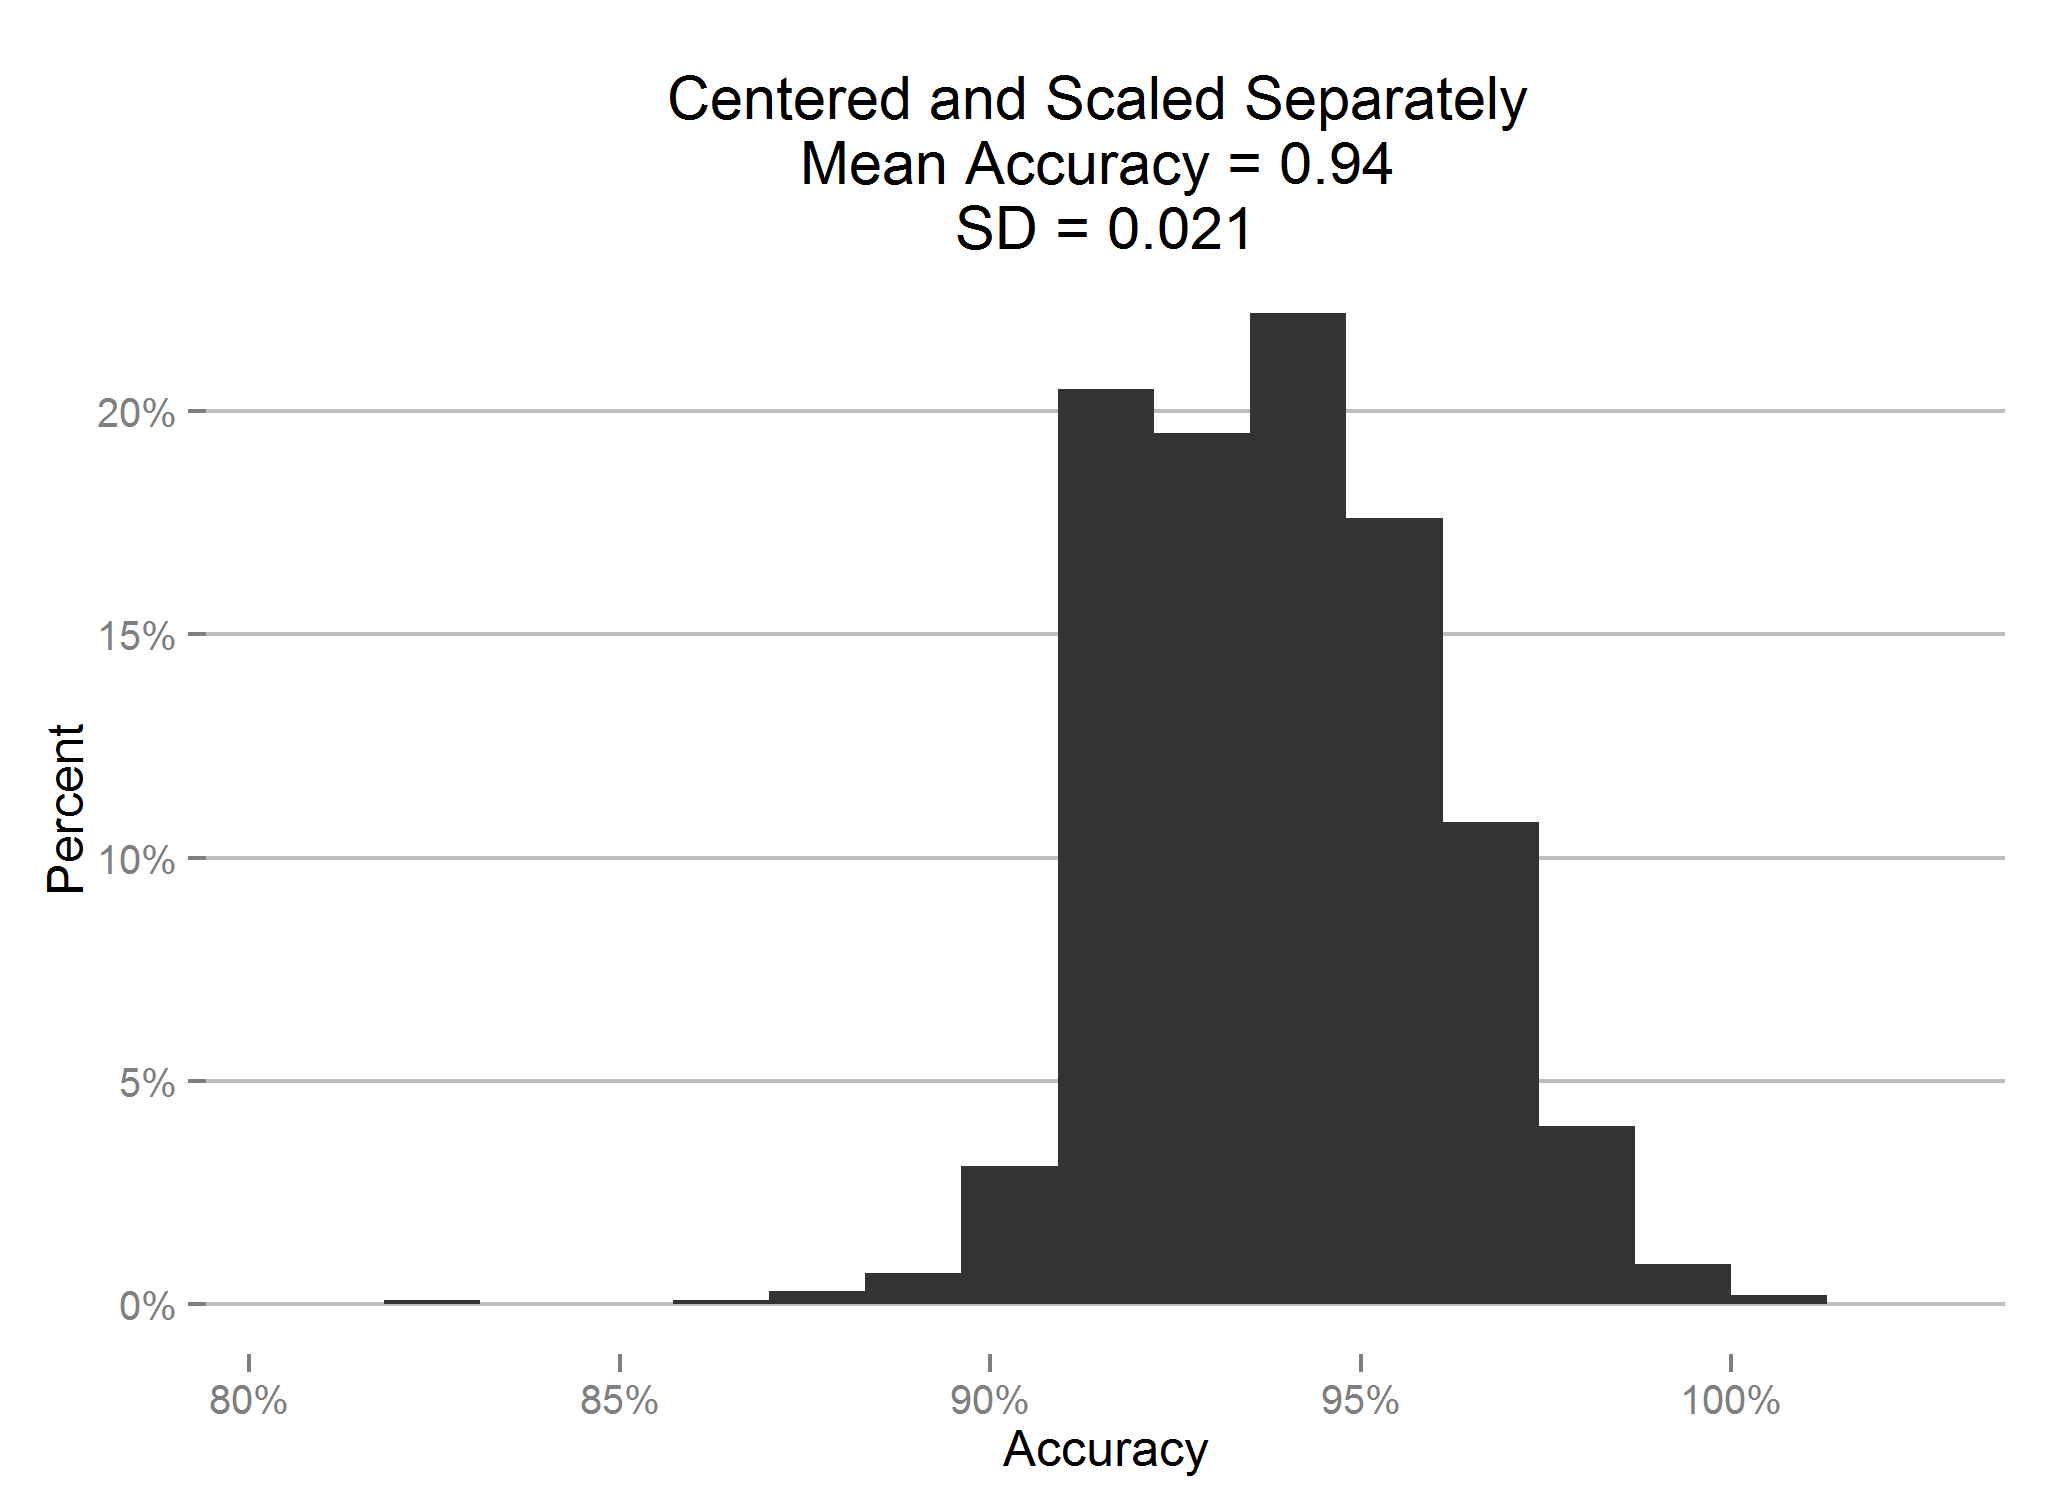
So, it appears that there is just the teeensiest increase in accuracy if we do it the right way. Is it statistically significant, though?
Statistical Significance
We can assess whether or not there is a difference in the mean accuracy between scaling together and scaling separately by using a t-test. From the histograms we can see that the accuracy scores are very roughly normal, so t-tests are appropriate here.
 	Welch Two Sample t-test

 data: Separate and Together
 t = 3.8542, df = 1996.389, p-value = 0.0001198
 alternative hypothesis: true difference in means is not equal to 0
 95 percent confidence interval:
      0.00179 0.00552
 sample estimates:
 mean of x mean of y
      0.939 0.936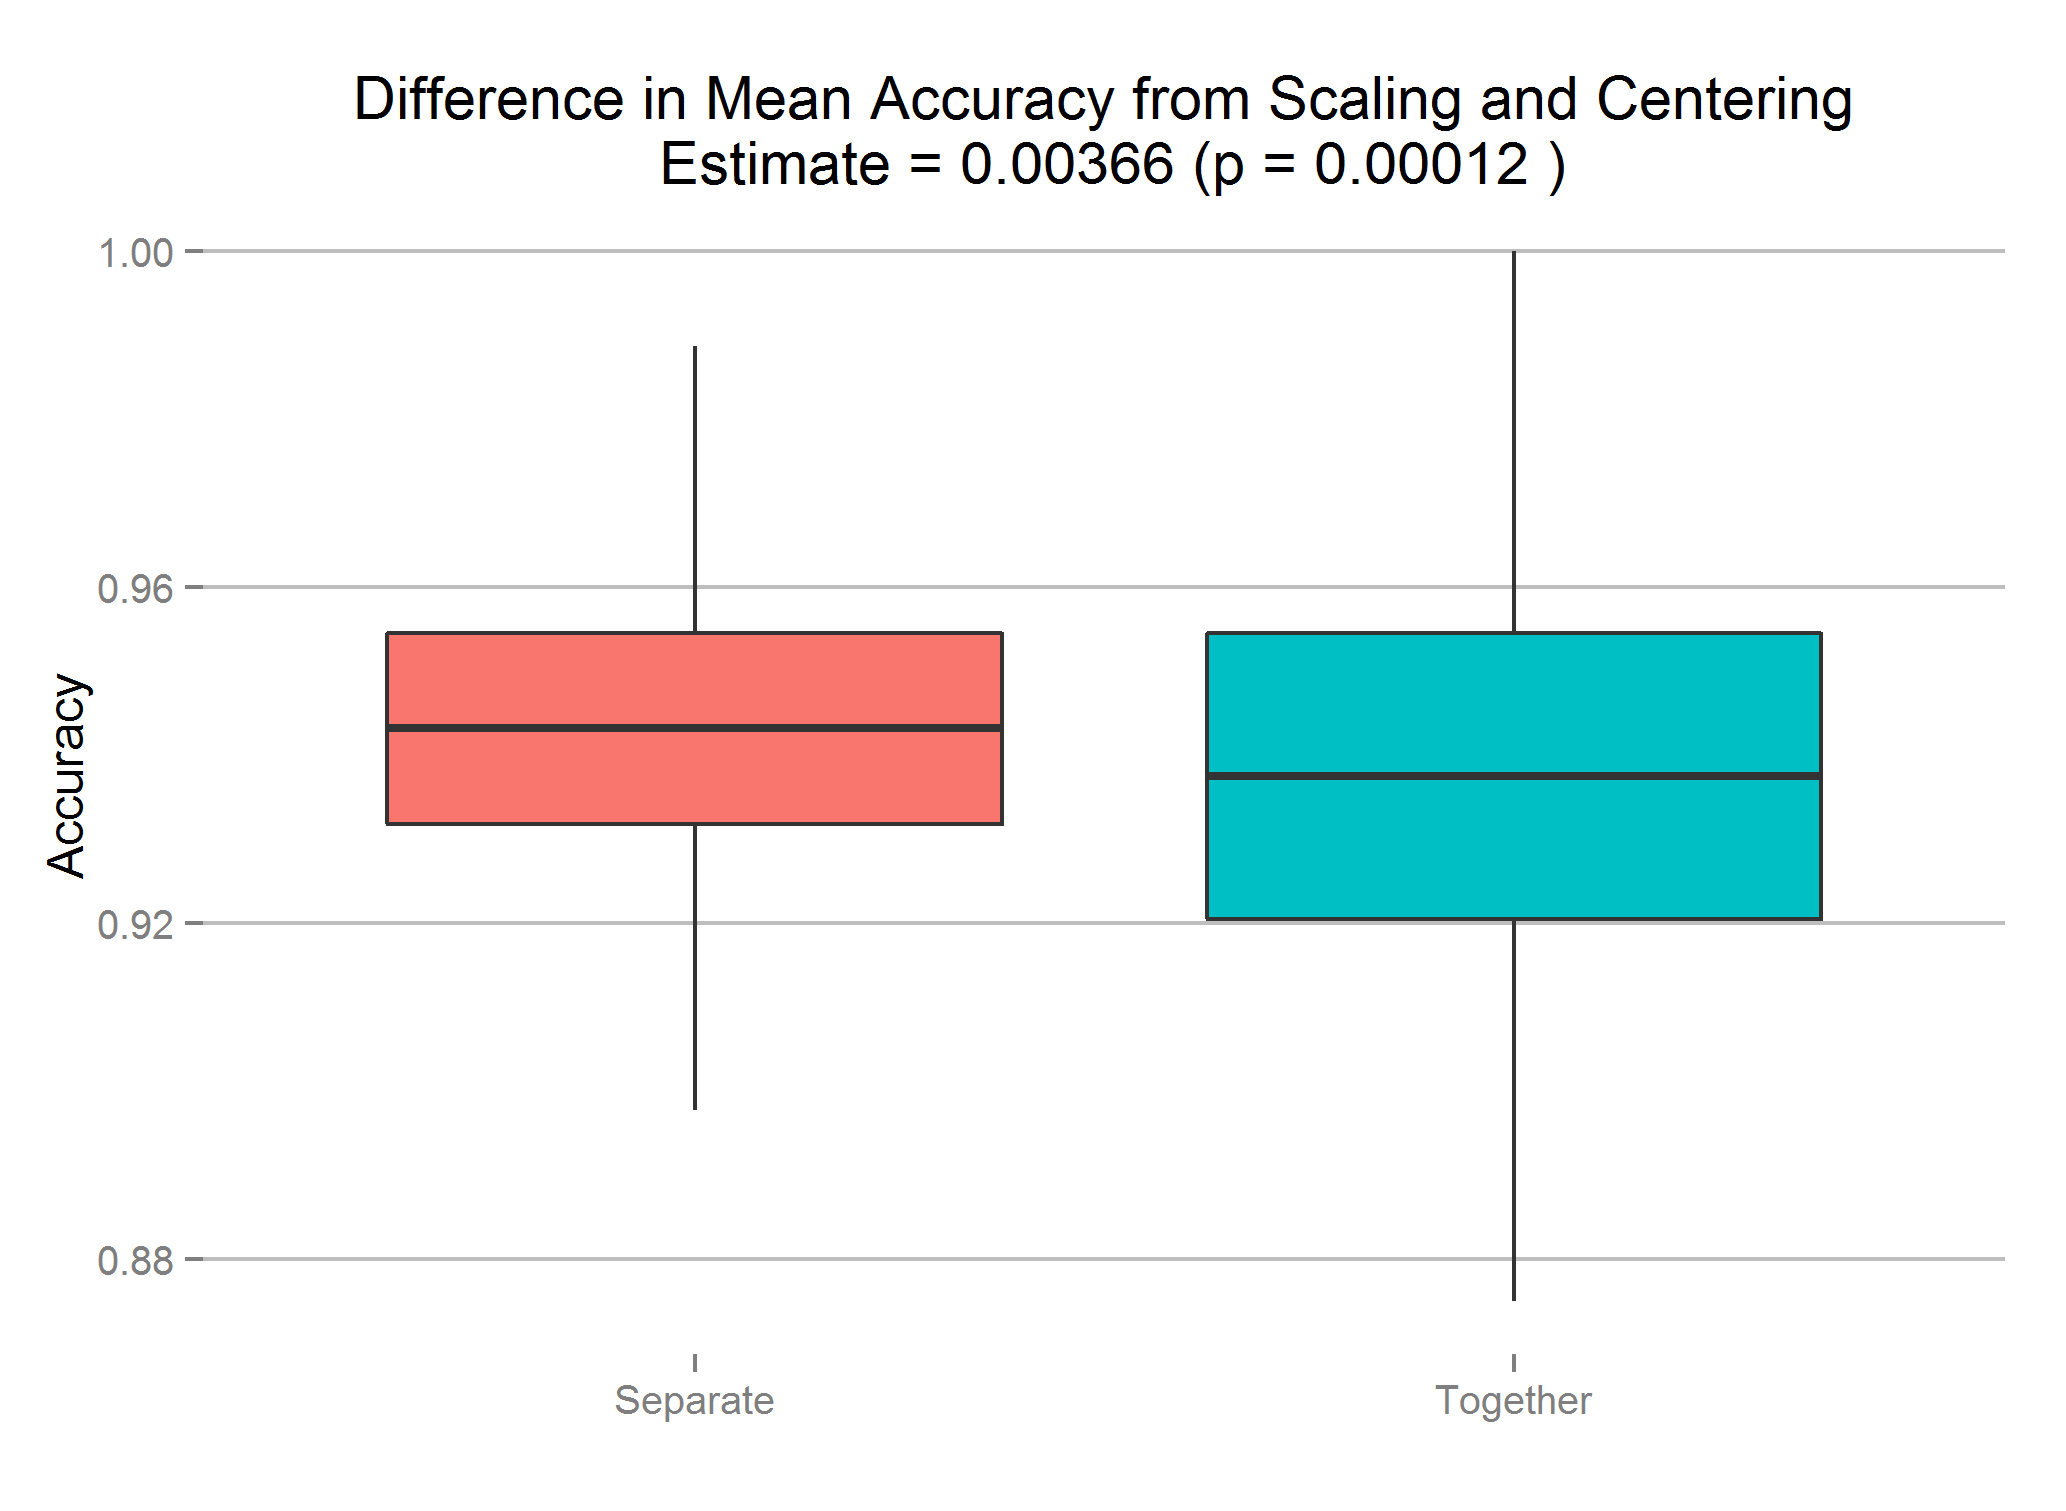
The difference is extremely small (around 0.4%), but it exists and is statistically significant.
Conclusion
As we saw, centering and scaling the data the proper way actually, for this dataset, leads to a tiny but statistically significant increase in the mean accuracy of the svm models. I have to admit to being surpised, I expected the opposite result! It would be interesting to see how the size of the dataset, and number of variables in the model impact this difference.
Of course, this was no fully rigorous test, but I do think it adds to the evidence that you should always center and scale your training and test data separately (not least because it’s the correct way!).
This post has a small discussion on reddit here and a reproducible version with code can be found here